Interpretation of Arctic Ocean Ice Records by Transglobe Expedition
It is unfortunate that the seismometer equipment loaned to the Transglobe Expedition for measurements across the Arctic Ocean was destroyed in the fire at Alert. However, the ice log kept by Fiennes reveals some interesting features of the changing ice cover.
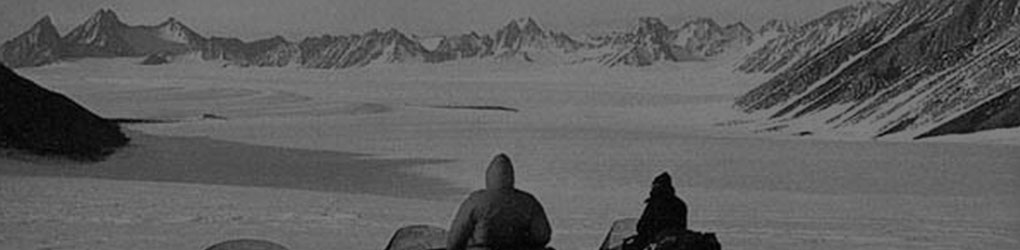
The expedition’s northward route from Alert to the Pole lay roughly along the 70°W meridian, which coincides with a route followed by H.M. nuclear submarine Sovereign in 1976. Sovereign profiled the ice thickness with an upward-looking sonar, and Transglobe’s observations agree quite well with those of Sovereign. The Transglobe travellers first encountered heavy pressure ridging and rubble fields but with plenty of narrow (10-30 m wide) leads — at least 1 per km. By 85-86°N large rubble fields were still in evidence, but alternated with large multi-year floes, 0.5-2 miles across, which were criss-crossed with steep, high pressure ridges. Active ridge formation was observed — they saw a pressure ridge 14 ft high being created by the crushing of young 14 inch thick ice in a lead, and when they camped they experienced ice tremors probably due to ridge generation nearby. From 86°N northward to the Pole the degree of ridging and rubble steadily decreased, with large flat floes permitting rapid travel.
Transglobe’s experience is in accord with sonar observations and theory. In this part of the Arctic Ocean the surface current called the Trans Polar Drift Stream, and a circulating current called the Beaufort Gyro, both combine to transport ice southward towards the northern coasts of Greenland and Ellesmere Island. As the ice comes to within about 400 km of land — at about 86°N —it begins to ‘feel’ the compressive effect of the downstream land boundary and starts to actively generate pressure ridges as areas of young ice are buckled and crushed. Therefore from Ellesmere Island north to 86°N we expect to see the results of this, i.e. many ridges and rubble fields, while active ridging is especially prevalent around 86 N. North of 86°N we expect to see less ridging. This effect was seen by Sovereign (P. Wadhams, Philosophical Transactions of the Royal Society, 1981) and predicted by theoreticians such as William D. Hibler III of the US Army Cold Regions Laboratory in Hanover, New Hampshire (Journal of Physical Oceanography, 1979 , but it is interesting to see it confirmed by surface observations.
Coming southward from the Pole, the party found a gradually increasing density of leads along the 10°E meridian, until by 86°N the terrain contained large quantities of new ice and open leads. This was finally sufficient to stop the party at 85°40’N; from 26th April they were forced to drift on the same floe which gradually accelerated southward. This zone of break-up and lead formations corresponds to the region where ice transported in the Trans-Polar Drift Stream begins to accelerate and funnel down towards Fram Strait, where the ‘conveyor belt’ of the East Greenland Current transports it out of the Arctic. The travellers were able to ride this conveyor belt and hence complete their crossing. Satellite images often show a great increase in lead frequency at about 86°N on this European side of the Arctic.
During the trans-polar journey the party made some interesting measurements of snow accumulation. Snow depth on the ice was measured daily as an average of ten probe measurements on flat areas of floes well away from ridges. When averaged weekly, the snow depth values were as follows:
| 23-29 March | 15.53 cm |
| 30 March – 5 April | 21.34 cm |
| 6-12 April | 23.66 cm |
| 13-19 April | 25.33 cm |
| 20-27 April | 24.55 cm |
Assuming that the selected floes were all old ones, these figures show a net accumulation of 9.02 cm of snow over a four week period, with indications that accumulation stopped by late April.
During their drift southward the party measured water depth in a melt water pool on the ice from 10th July to 1st August, finding that at the deeper of two locations it increased from 35 cm on 10th July to a maximum of 44 cm on 16th – 19th July, falling to 13 cm by 1st August. As summer advances melt pools often drain partially away by the melting-out of brine drainage channels in the ice underneath them, which then connects them with the sea. This appears to be the process that took place.
Dr Peter Wadhams
Scott Polar Research Institute